Aleph
A library for exploring persistent homology
Here, we briefly document how to reproduce the results reported in the paper ‘Shall I compare thee to a network?’—Visualizing the Topological Structure of Shakespeare’s Plays, which was presented at the Workshop on Visualization for the Digital Humanities at IEEE VIS 2016.
While Aleph was not originally used to obtain these results, we still want to demonstrate how to perform the analysis of the paper using Aleph’s various tools.
Setup
First, you need to obtain all the co-occurrence networks.
Creating persistence diagrams
In order to create the persistence diagrams as described in the paper, please use the following script:
#!/usr/bin/env zsh

ALEPH_DIR=$HOME/Projects/Aleph
ALEPH_BUILD_DIR=$ALEPH_DIR/build

NETWORK_ANALYSIS_BINARY=$ALEPH_BUILD_DIR/examples/network_analysis
SPLIT_OUTPUT_BINARY=$ALEPH_DIR/utilities/split_output.py

OUTPUT_DIR=/tmp

for file in $argv; do
  OUTPUT=${file:t:r}".txt"
  $NETWORK_ANALYSIS_BINARY $file 2  > $OUTPUT_DIR/$OUTPUT
  $SPLIT_OUTPUT_BINARY --prefix=d --digits=1 $OUTPUT_DIR/$OUTPUT
done
Run this script on all networks:
$ ./make_persistence_diagrams.sh Networks/Speech/*.net
As a result, you will obtain a set of persistence diagrams in the root directory of the script.
Creating distance matrices
The distances between persistence diagrams may now be analysed in order
to obtain a dissimilarity matrix. To this end, go to your installation
directory of Aleph and use the topological_distance tool on all
persistence diagrams. The tool is sufficiently smart to group
persistence diagrams automatically according to their dimension. Let us
first create a Hausdorff distance matrix:
$ topological_distance --hausdorff --power=2 *.txt > Matrix_Hausdorff.txt
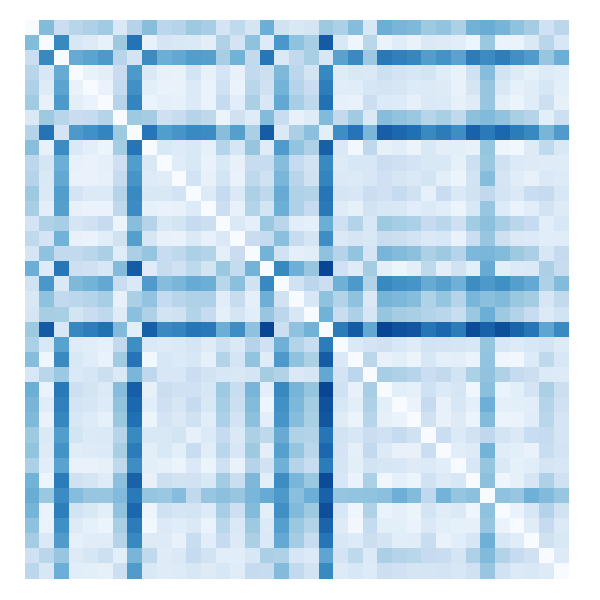
We can plot the matrix using gnuplot, for example:
$ gnuplot
gnuplot> unset key
gnuplot> unset tics
gnuplot> unset border
gnuplot> unset colorbox
gnuplot> load "/usr/share/gnuplot-colorbrewer/sequential/Blues.plt"
gnuplot> plot "Matrix_Hausdorff.txt" using ($1):(-$2):3 matrix with image
The resulting file should look somewhat similar to this:
By varying the command-line options of the topological_distance tool,
other embeddings can be obtained:
$ topological_distance --wasserstein --power=2 *.txt > Matrix_Wasserstein_2.txt
$ topological_distance --wasserstein --power=1 *.txt > Matrix_Wasserstein_1.txt
In the final step, we will embed those matrices, i.e. we will assign them coordinates.
Embedding distance matrices
The output format of the previous program is sufficiently generic to support using a variety of other scripts. Use the following gist, for example, to embed a matrix into 2D using multidimensional scaling:
The resulting 2D point cloud could look like this:
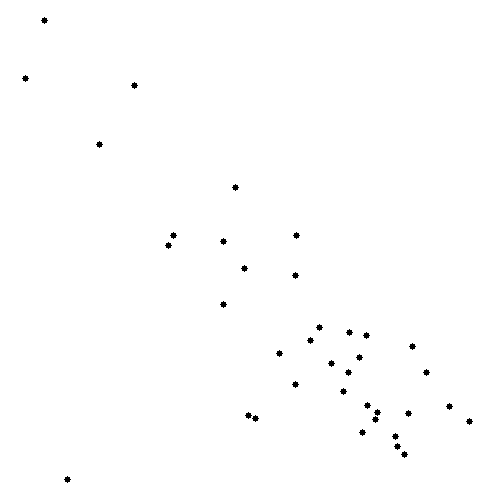
The previous embedding was created using the Hausdorff distance. Depending on the parameters you use for calculating topological distances, yours may look a little different.